

Welcome to your Sales Admin
Go Fig is a Sales Admin that helps an AE stay on top of their pipeline and move deals forward. Connect the CRM you already have, get a daily brief, and approve every send. The boards, flows, and Celeste sit underneath the agents. They are what the agents read from, not a second product to shop.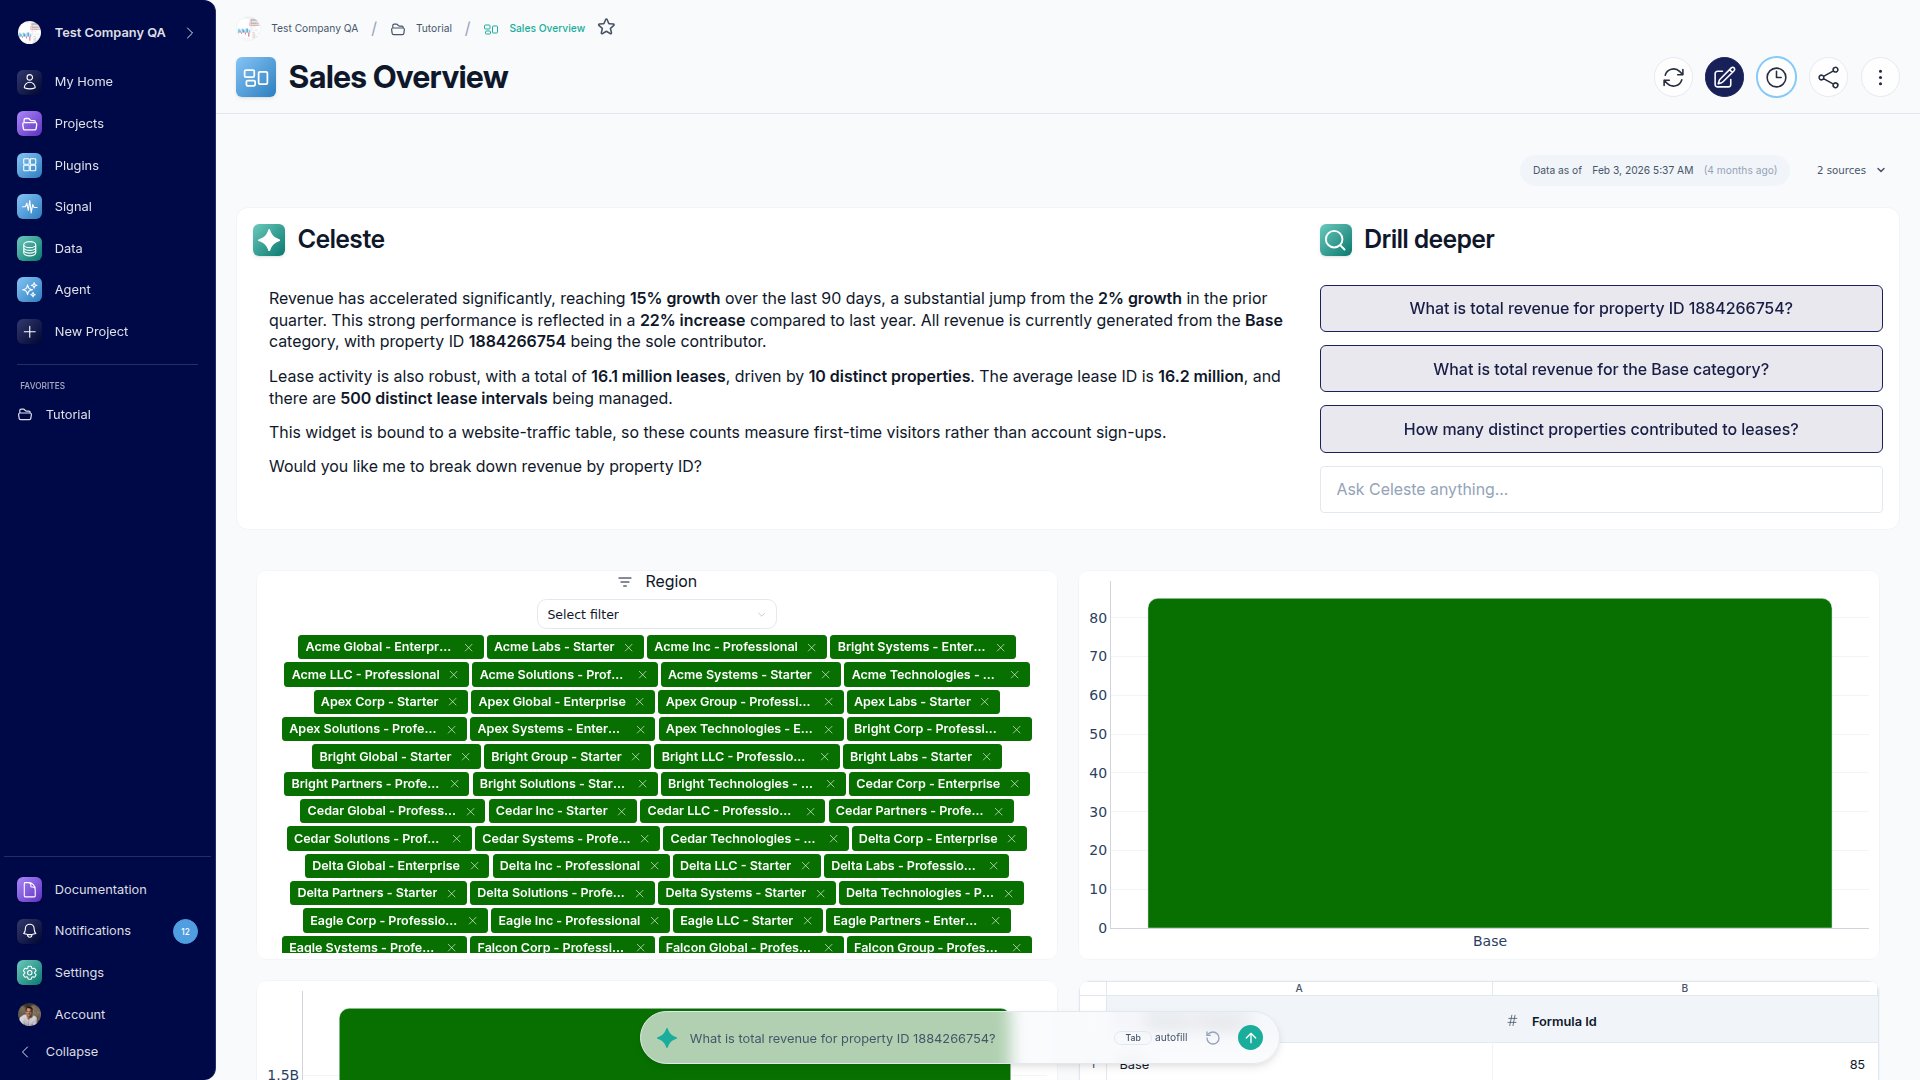
Quick Start
Get up and running with Go Fig in just a few minutes:1
Create your account
Sign up at app.gofig.ai and create your organization
2
Connect your first data source
Go Fig allows you to connect databases, upload spreadsheets, and syncs data from 20+ SaaS apps. For this quick start, we’ll use a CSV upload - the fastest way to get started.
- Navigate to Data in the left sidebar
- Click Add data source on the top right of the page
- Select from the list of Connectors
- Choose Upload and drag-and-drop your file
3
Build your first flow
Flows let you transform and analyze data visually. Let’s create a simple one:
- Create your first project by clicking New Project in the left sidebar and give it a name
- Click + Add Flow and give your Flow a name
- Add a Get Data node and select your CSV data source
- Add a Transform node and connect it below Get Data
- In the Transform node’s PivotTable tab, group by
product_nameandsale_monthand sumorder_amountto total sales for each product by month - Add a Save Table node to store the results as a Virtual Table
- Click Run to execute your Flow
4
Create your first dashboard
Now let’s visualize your filtered data:
- Navigate back to your project
- Click + Add Dashboard and name it “Sales Overview”
- Drag the Figure option from the toolbar onto your dashboard canvas
- Select the Virtual Table your Flow saved with the Save Table node
- Set dimensions and metrics: group by
product_nameandsale_month, withorder_amount(sum) as the value - Choose a chart type, and the preview updates as you configure it
5
Share with your team
Ready to share? Click the Share button in the top-right corner:
- Share your project with another member in your organization to collaborate on your flow and dashboard
- Publish the flow and dashboard to your Team page for organization-wide visibility
- Export dashboards as a PDF or share a public link for external stakeholders
What you just built: A flow that reshapes a table, and a board that reads it. That layer is what your Sales Admin agents work from.
Detailed Guides
Connect Your Data
Connect databases, sync apps, or upload files
Build Flows
Transform and analyze data with visual flows
Create Dashboards
Build beautiful dashboards to share insights
Celeste AI Assistant
Ask questions of the data your Sales Admin already reads
Need Help?
Contact Support
Our support team is here to help you succeed with Go Fig.