

Overview
Share dashboards publicly via links, embed on websites, or export as PDFs and images. Control access with password protection while maintaining data security.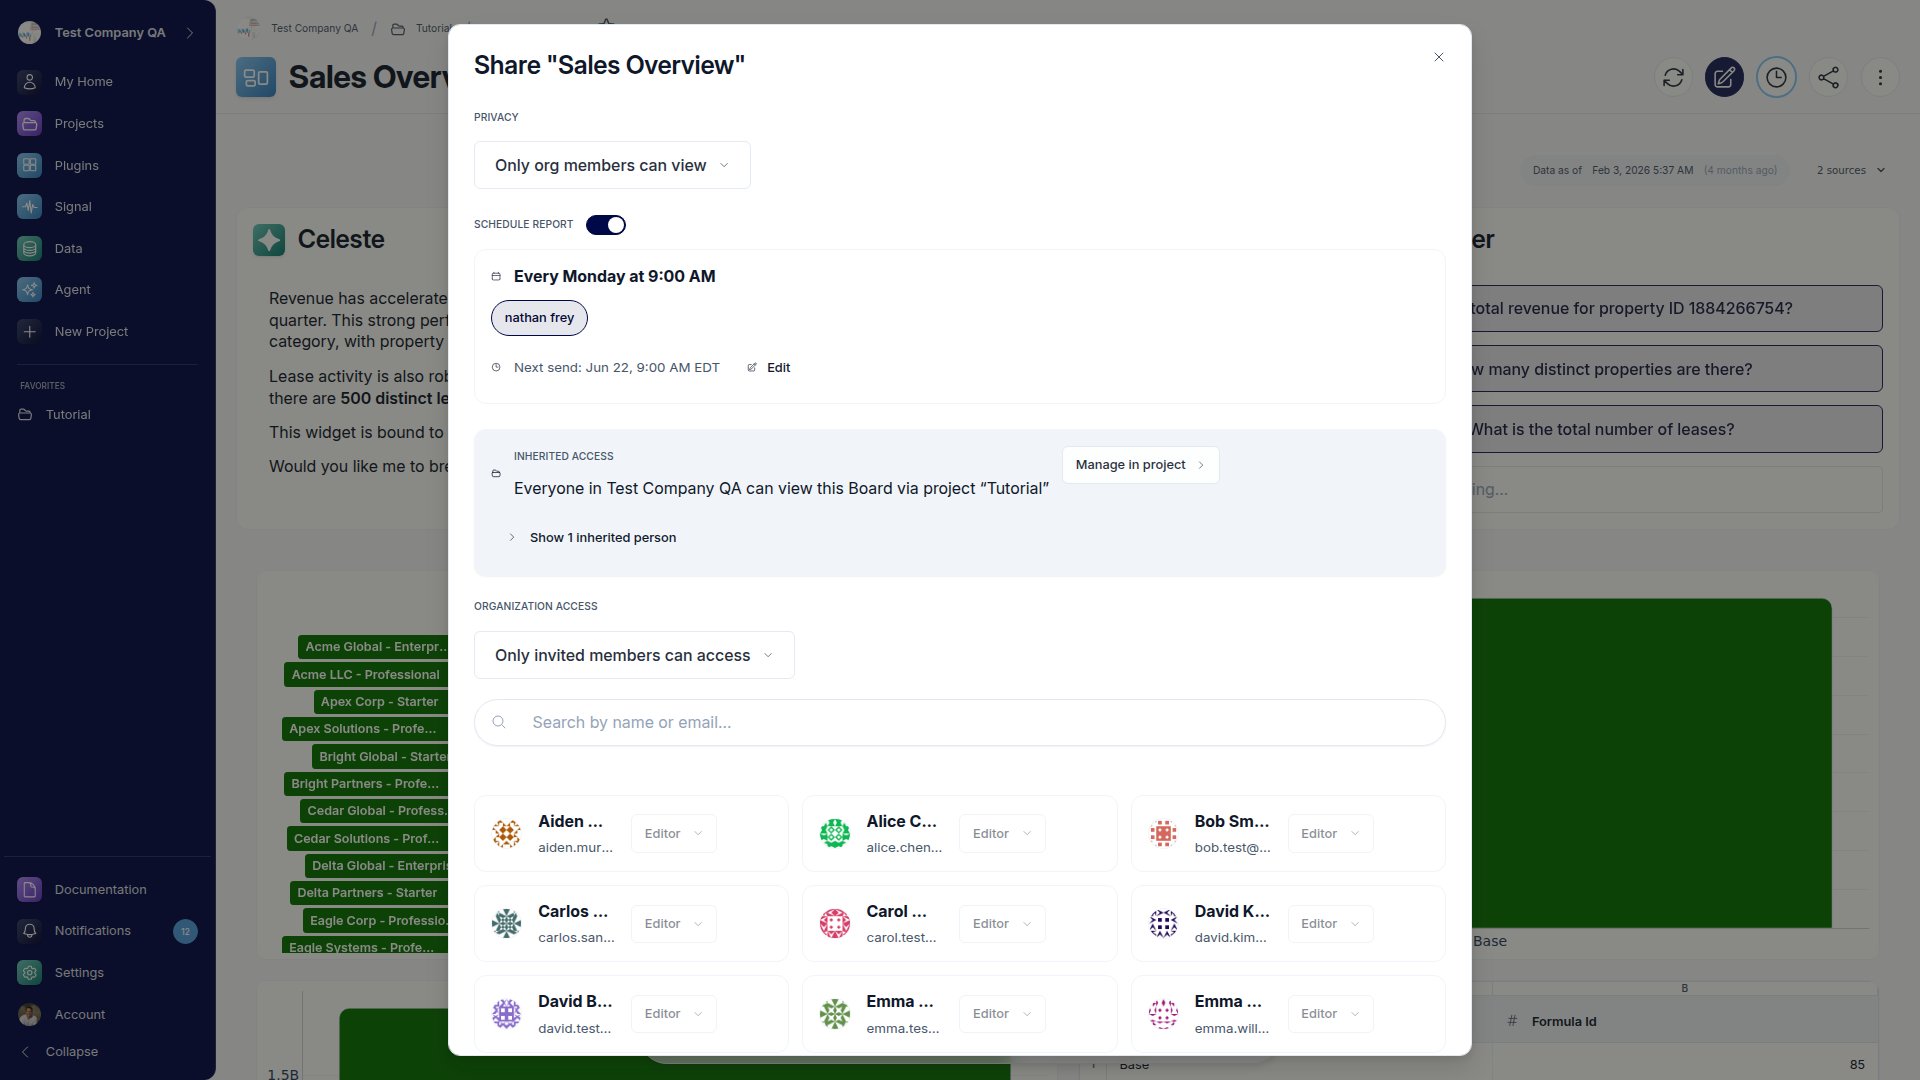
- Private: Only organization members can view the dashboard
- Share with User: Specific organization members with view or edit access
- Public: Anyone with the link can view the dashboard
- Password Protected: Anyone with the link AND password can view
- Embed Code: Generate iframe embed code for public dashboards
- Export: Download as PNG image or PDF document
Data Security: When sharing publicly, viewers see the dashboard data as it was configured. Ensure you’re comfortable with the data being visible before sharing.
How to Share
1
Open Share Modal
Click the Share button in the dashboard top bar (or from the More menu).
2
Select Sharing Status
Choose your sharing preference from the dropdown:
- Private - Dashboard only visible to organization members
- Share with User - Choose specific users and permission levels (View Only or Edit)
- Public - Anyone with the link can view
- Password Protected - Requires password to view
3
Copy Link or Embed Code
For public or password-protected dashboards:
- Copy Link: Click the copy button next to the URL
- Embed Code: Copy the iframe code to embed on your website
Sharing with Team Members
Share individual dashboards with specific organization members without sharing the entire project. Recipients see shared dashboards in their “Shared projects” section with scoped access to only that dashboard. API Access: Shared dashboards are accessible via API endpoints. Users with dashboard shares can query widget data and dashboard metadata through REST API calls.1
Open Share Modal
Click the Share button in the dashboard top bar.
2
Select 'Share with User'
Choose Share with User from the sharing status dropdown.
3
Choose User and Permission Level
- Select the organization member from the user dropdown
- Choose permission level:
- View Only: User can view the dashboard but cannot edit
- Edit: User can view and modify the dashboard
4
Save and Notify
Click Save to grant access. The user receives a notification and sees the dashboard in their “Shared projects” section.
Scoped Access: When you share a dashboard with a user, they only have access to that specific dashboard, not the entire project or other dashboards within the project.
Organization-Wide Access
For larger teams, you can make a dashboard accessible to all organization members at once, with no individual invitations needed. Access Levels:- Restricted (default): Only explicitly shared users can view the dashboard
- Anyone can view: All organization members can view; only shared users can edit
- Anyone can edit: All organization members can view and edit
Exporting Dashboards
Download your dashboard as an image or PDF for offline viewing, presentations, or sharing outside Go Fig. Exports render with full fidelity: charts include legends, tables display actual data (up to 50 rows and 10 columns), and text formatting is preserved.1
Open Share Modal
Click the Share button in the dashboard top bar.
2
Choose Export Format
In the “Download Dashboard” section:
- Download as PNG - High-quality image of your dashboard (1920px width)
- Download as PDF - PDF document suitable for printing
3
Wait for Download
The export process may take a few seconds for large dashboards. A progress indicator shows the export status.
Export Rendering: Tables in exports show up to 50 rows and 10 columns of actual data. For dashboards with more than 24 widgets, consider breaking into multiple dashboards for optimal file size and clarity.
Scheduled Email Reports
Send a snapshot of your dashboard to a list of recipients on a recurring schedule, with no manual exports needed. Recipients get an email on the cadence you choose, with a link to the live dashboard and optional PDF, Excel, or branded-report attachments.1
Open the Schedule panel
From the dashboard, click the Share button, then select the Schedule tab.
2
Set the cadence
Choose how often to send the report: Hourly, Daily, Weekly, Monthly, or Quarterly. The next send time updates as you configure.
3
Add recipients
Add org members from the dropdown and/or type in any external email addresses. Each address receives its own copy of the email.
4
Customize the email
Write a Subject line and optional Message body, then choose what each email includes: a link to the live dashboard, an attached PDF, an attached Excel workbook (with the underlying data), and, if your plan includes it, a branded report. At least one of these must be on.
5
Save and enable
Toggle the schedule On and click Save. Use the Send now button any time to dispatch the email immediately without waiting for the next scheduled run.
Toggling the schedule off preserves all your settings (cadence, recipients, subject, variants). Turn it back on at any time to resume without reconfiguring.