
What This Node Does
The Segment node groups rows into clusters using K-means on one or more numeric features. Use it to discover natural segments in your data (customers who behave similarly, products with comparable economics, accounts with comparable risk profiles) without hand-coding the rules. Segment can either pick the number of clusters automatically (the default) or run with a fixed cluster count when you already know how many segments you want.When to Use This Node
Use the Segment node when you need to:- Identify customer segments by spend, frequency, and recency without hand-tuning thresholds
- Cluster vendors or accounts by transaction volume, average size, and category mix
- Group SKUs into pricing tiers based on margin, velocity, and revenue contribution
- Find peer groups for benchmarking individual entities against similar ones
Step-by-Step Usage Guide
1
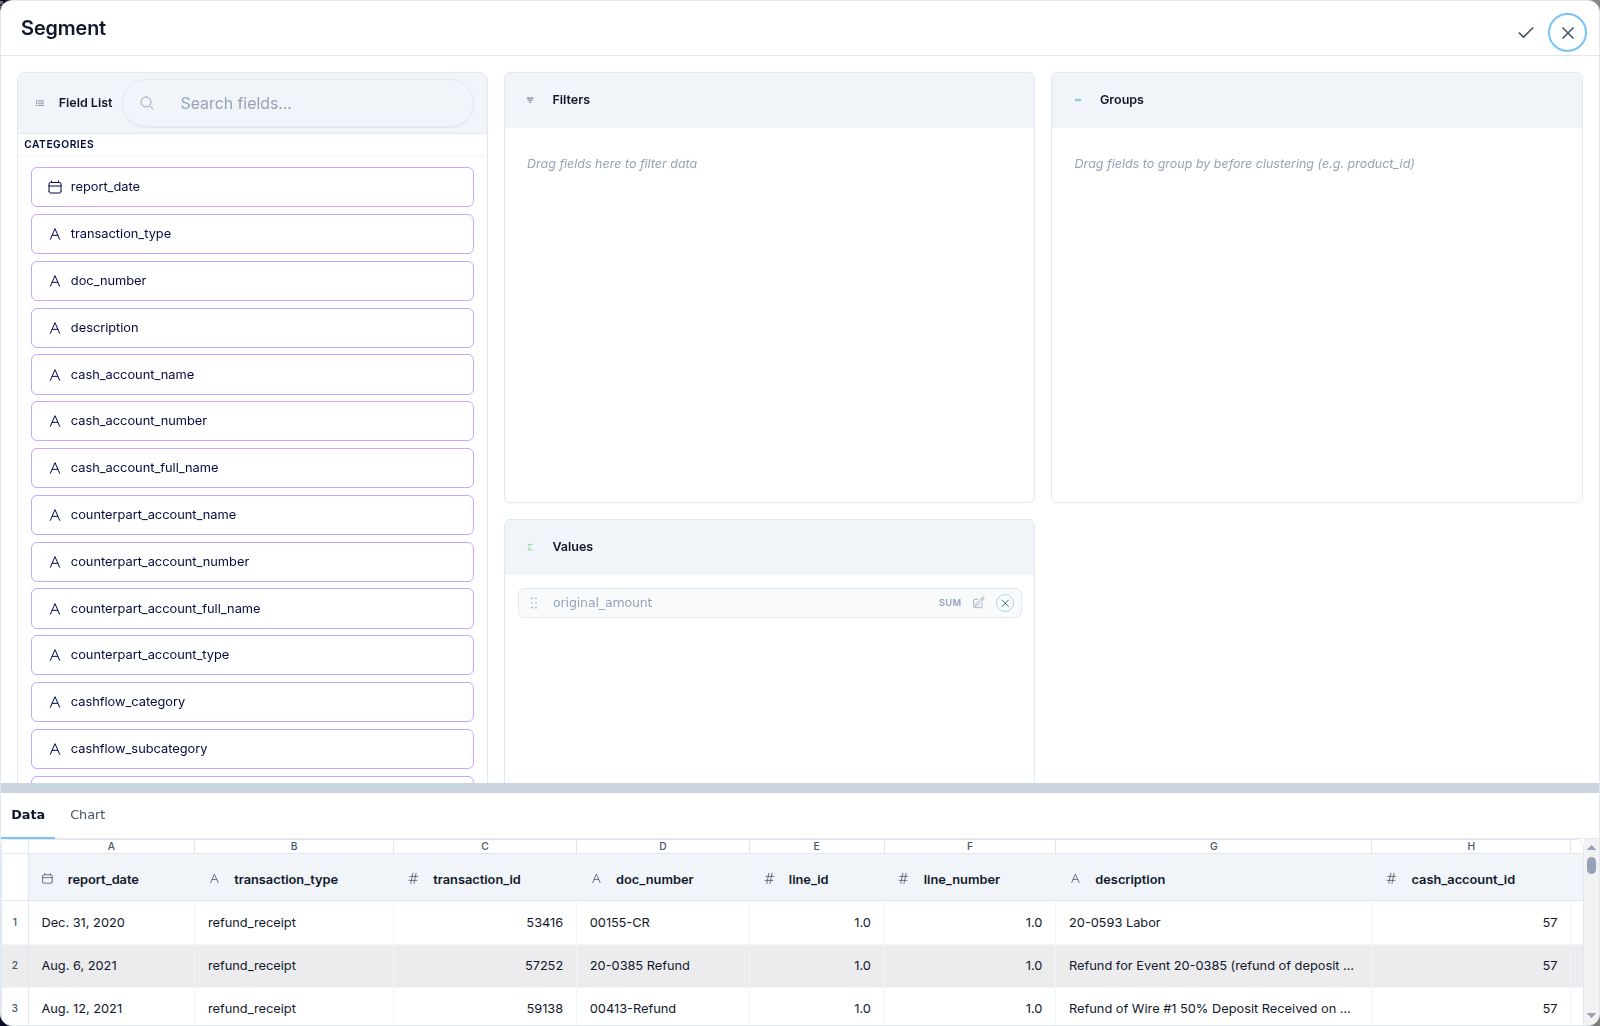
Configure the buckets
- Rows: the entity field(s) you want one segment label per. Most commonly
customer_id,account_id,vendor_id, orsku. - Values: the numeric features to cluster on (e.g.,
total_spend,order_count,days_since_last_order). Pick an aggregation per field. Two to five features is the sweet spot. - Filters (optional): pre-filter the input (e.g., exclude inactive customers, limit to last 12 months).
2
Decide auto-k or fixed-k
- Auto (default): leave Fixed Clusters blank. Go Fig fits k = 2 through Max Clusters (default 8) and picks the best k by silhouette score. Use this when you’re exploring.
- Fixed: set Fixed Clusters to a specific integer (2 to 20). Use this when you have a downstream constraint, e.g., a marketing program that maps to exactly 4 tiers.
3
Set Max Clusters (auto mode only)
Caps the search range when auto-k is on. Default 8 covers most business segmentation cases. Raise to 12 to 15 for large entity sets where you suspect more granular structure. Lower to 4 or 5 for executive-friendly outputs.
4
Run and inspect the segments
Output adds a
segment field (integer label, 0-indexed) to each entity row. Connect a downstream Aggregation node to summarize the segments by feature (mean spend per segment, count per segment). That’s how you describe what each segment means in business language.